

Most HR departments track metrics like people track their exercise habits—great intentions, inconsistent execution, and lots of excuses when the numbers don't add up. The turnover calculation from March doesn't match June's method. Someone "updated" the time-to-fill formula without telling anyone. Nobody can explain why attrition jumped 40% last quarter.
This isn't about being bad at spreadsheets. It's about running HR without a metrics backbone.
A 200-person tech company I worked with had their CHRO spending entire board meetings explaining why the numbers looked different from last quarter. Not because anything actually changed—because someone calculated voluntary turnover differently. Another company reported two different headcount numbers to investors for six months straight. One included contractors, the other didn't. No one documented which was which.
Without reliable HR metrics, you're making million-dollar people decisions based on hunches. You promote managers who can't actually manage. Miss early warning signs before your culture implodes. Waste recruitment budgets on channels that don't work. Build compensation packages that push your best people toward the exit.
The companies that get this right don't just track better metrics—they build systems that make metrics trustworthy. They create what I call an HR metrics operating system: the taxonomy, cadence, and ownership structure that turns unreliable numbers into operational intelligence.
Why HR metrics break (and finance metrics don't)
Finance teams operate with a chart of accounts that defines every line item. Revenue recognition rules that determine when sales count. Monthly close processes that produce consistent numbers quarter after quarter. Audit trails showing exactly who changed what and when.
Now think about your HR metrics. Who defines "voluntary turnover" at your company? Does it include people on performance improvement plans who "chose" to leave? What about contractors who convert to full-time employees? Internal transfers between departments?
Most companies figure this out during a crisis. The board wants to know why engineering turnover hit 35%. Except maybe it didn't. Depends who calculated it and when.
This chaos happens because HR departments inherit metrics instead of designing them. Someone reads that "time-to-fill should be 45 days" and starts tracking it without considering that filling a senior engineering role takes fundamentally different effort than hiring customer service reps. Averaging them together tells you nothing useful about either process.
At 50 employees, you can track metrics informally. At 200, the informal system starts breaking. At 500, you're operating blind. Every new HR hire brings definitions from their previous company, creating three different ways to calculate cost-per-hire with no consensus on which one actually matters.
Building reliability through taxonomy
A metric without a clear definition is just a number that starts arguments. An HR metrics operating system begins with taxonomy—documented definitions of what you're measuring, how you're measuring it, and why it matters.
Eliminate HR bottlenecks with smart automation.
Hiryly simplifies your HR operations so you can focus on people, not paperwork.
- Centralized candidate tracking
- Automated onboarding workflows
- Performance & compliance dashboards
No credit card required
Take headcount. Seems straightforward until you encounter:
-
Employees on extended medical leave
-
Part-time workers (count as 1.0 or based on hours?)
-
Long-term contractors with indefinite assignments
-
People with signed offers but future start dates
-
Employees in their notice period
One retail company had three different headcount numbers in circulation. HR counted 847 employees. Finance counted 892 (included contractors). Operations counted 823 (only customer-facing roles). All three were technically correct for their specific needs, but nobody had documented those differences.
Effective taxonomy answers specific questions for each metric:
What exactly are we measuring? Instead of "turnover," try "voluntary resignation of full-time employees within their first 12 months, excluding layoffs, performance terminations, and contractor conversions."
Where does the data originate? Source systems matter enormously. Turnover from your HRIS might differ from turnover in financial reports if they pull data at different times or classify employees differently.
How do we calculate it? Document the actual formula. For turnover: (Number of voluntary terminations in period) / (Average headcount during period) × 100. Specify whether "average headcount" means beginning of period, end of period, or midpoint calculation.
What are the edge cases? List them explicitly. If someone submits resignation on December 31st but their last working day is January 15th, which period counts the termination?
Why does this metric matter? Connect it directly to business outcomes. "First-year turnover" indicates hiring quality and onboarding effectiveness, which directly impact team productivity and recruitment costs.
The cadence problem nobody solves
Financial metrics follow natural business rhythms. Daily cash positions for liquidity management. Weekly sales reports for pipeline health. Monthly P&Ls for operational performance. Quarterly earnings for investor relations.
HR metrics typically follow the rhythm of "whenever someone asks for them," which creates either constant fire drills or months of silence followed by panic.
Different metrics need different heartbeats based on how quickly you can act on the information. Real-time headcount matters for capacity planning. Weekly recruitment metrics keep hiring pipelines healthy. Monthly turnover analysis reveals cultural trends. Annual compensation reviews require...annual data cycles.
What usually breaks: HR pulls monthly reports showing 18% turnover. The CEO panics. You spend three days investigating only to realize December always spikes because people wait for year-end bonuses before leaving in January. You knew this last year. And the year before. But without documented cadence, every pattern feels like a crisis.
A cadence matrix maps each metric to its natural decision cycle:
Weekly metrics:
-
Open requisitions by priority level
-
Interviews scheduled versus completed
-
Offers extended and accepted
-
Confirmed start dates for new hires
Monthly metrics:
-
Turnover by department, tenure, and stated reason
-
Time-to-fill trends by role complexity
-
Cost-per-hire including hidden expenses
-
Employee engagement pulse scores
-
Overtime usage and capacity utilization
Quarterly metrics:
-
Compensation benchmarking against market data
-
Performance rating distribution across teams
-
Succession planning coverage gaps
-
Training ROI and skill development progress
-
Diversity metrics and representation trends
Annual metrics:
-
Total compensation competitiveness
-
Long-term retention by hiring cohort
-
Cultural assessment and engagement surveys
-
Full-cycle recruiting process efficiency
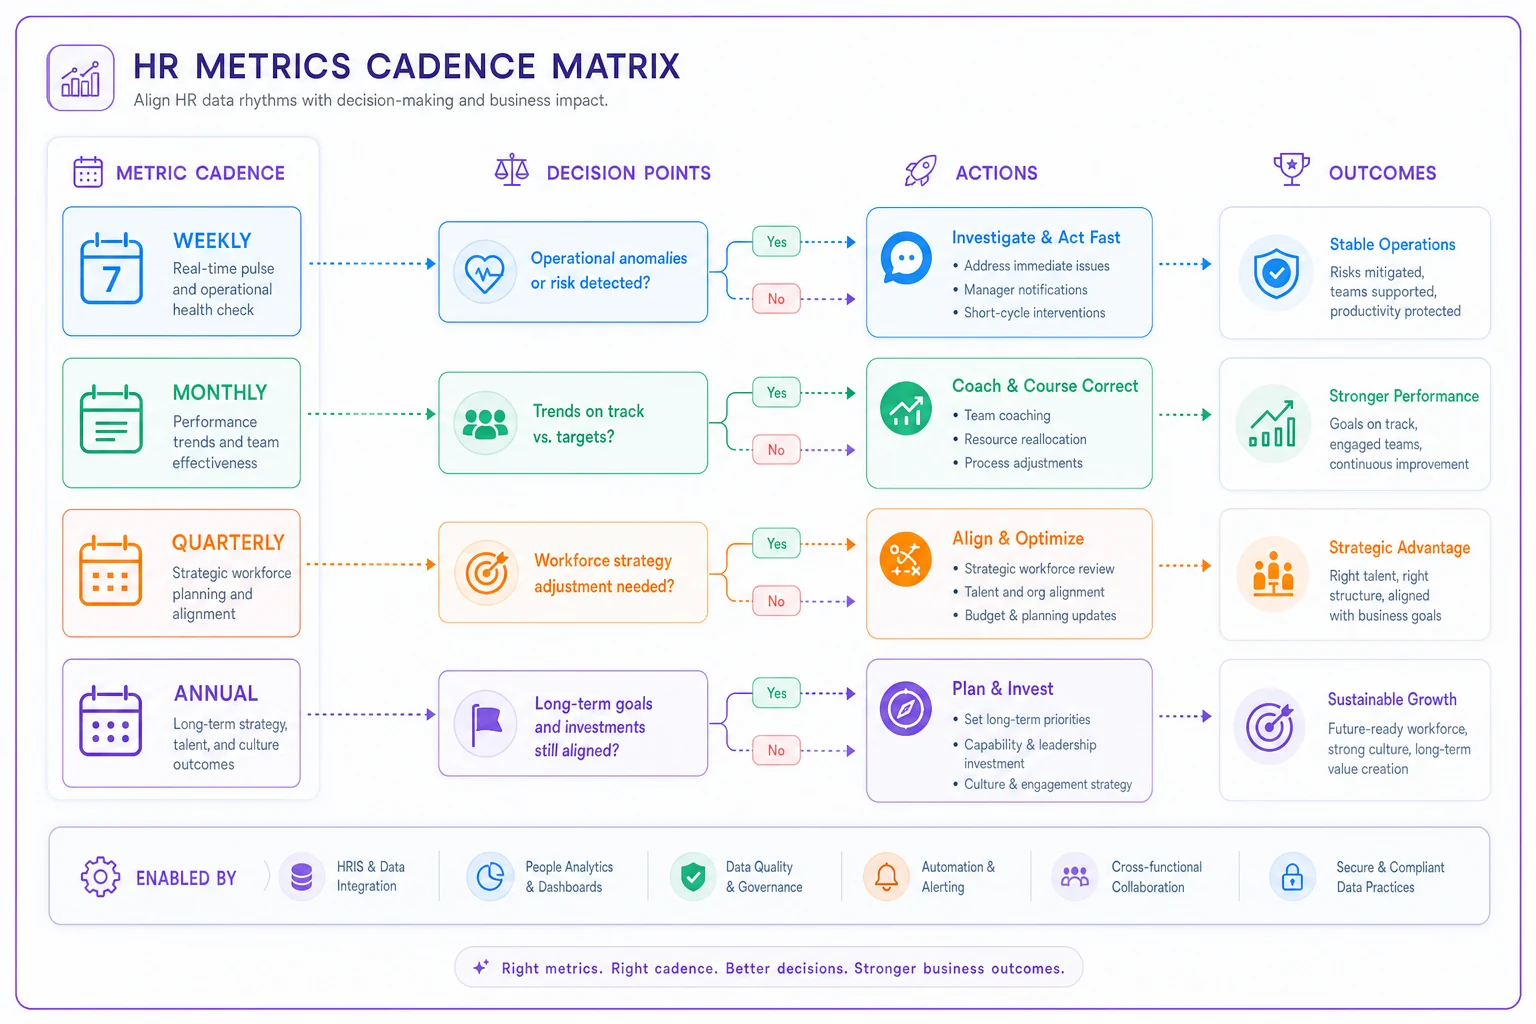
The cadence needs to match decision-making speed, not data availability. If you only adjust compensation annually, weekly salary reports create noise instead of insight. If you can pivot recruiting strategy monthly, quarterly pipeline reports arrive too late to influence outcomes.
Data ownership: the RACI matrix everyone avoids
The worst HR meetings start like this: "The turnover number looks wrong." "Which turnover number?" "The one in the dashboard." "Which dashboard?" "From the monthly report." "Who creates that report?" "I thought you did."
This happens when everyone technically owns the metrics, which means nobody actually owns them.
A RACI matrix for HR metrics sounds like bureaucratic overhead until you've watched three different people calculate three different turnover rates for the same board presentation. One used fiscal year dates. Another used calendar year. The third excluded a recent acquisition. All three calculations were technically correct. The board was thoroughly confused.
Document clear ownership for each metric:
Responsible: The single person who produces this number. Not a department, not a role title—a specific person's name. When the metric looks wrong, this person investigates and fixes it.
Accountable: The leader who presents this metric in meetings and makes strategic decisions based on it. Usually the CHRO or a department VP.
Consulted: People who provide context or input. Finance teams for cost-related metrics, department heads for team-specific data, legal for compliance measurements.
Informed: Everyone who receives the reports but doesn't contribute to creating them.
Most HR teams treat every metric as equally critical. Your CEO doesn't need weekly updates on tuition reimbursement utilization. Your recruiting coordinator doesn't need real-time executive compensation benchmarks. Match information access to actual decision-making authority.
A software company learned this lesson when they gave universal dashboard access in the name of "radical transparency." Within a week, engineers were debating why marketing showed higher average salaries (different role seniority distribution), sales was panicking about their turnover rate (actually normal for the industry), and customer service felt undervalued based on training budget allocation (they needed less technical training). Complete transparency without proper context created more organizational problems than it solved.
Dashboard proliferation and the three-tier solution
Everyone wants an HR dashboard until they actually get one. Then they want a different one. Then they want seventeen different ones.
Modern dashboard tools make this worse by letting anyone create colorful charts in minutes. By month three, you have 47 different dashboards showing conflicting numbers, all of which someone insists is absolutely critical for their role.
The solution isn't building better dashboards—it's building fewer dashboards with clearer purposes.
Use three distinct levels:
| Tier | Purpose / Example Metrics |
|---|---|
| Executive dashboard: 5-7 metrics maximum | - Current headcount and month-over-month growth rate - Voluntary turnover (trailing three-month average) - Time-to-fill for business-critical roles - Overall engagement or eNPS score - Fully-loaded cost per employee |
| Operational dashboards: 15-20 metrics per functional area | - Recruiting: pipeline health by stage, source effectiveness, interviewer utilization rates - Compensation: salary range penetration, equity usage trends, promotion budget tracking - Learning: training completion rates, identified skill gaps, program ROI measurements - Employee relations: case volume trends, average resolution time, policy violation patterns |
| Analytical dashboards: Unlimited metrics for specific investigations | Built for temporary, question-specific analysis. Why did engineering turnover spike in Q3? What's driving warehouse overtime increases? How does performance rating correlate with long-term retention? |
Notice what's missing: detailed breakdowns, historical trends beyond one quarter, anything requiring contextual explanation. Executive dashboards answer exactly one question: "Should I be worried?" If yes, they'll request details.
Executive dashboard: 5-7 metrics maximum
-
Current headcount and month-over-month growth rate
-
Voluntary turnover (trailing three-month average)
-
Time-to-fill for business-critical roles
-
Overall engagement or eNPS score
-
Fully-loaded cost per employee
Operational dashboards: 15-20 metrics per functional area
-
Recruiting
pipeline health by stage, source effectiveness, interviewer utilization rates
-
Compensation
salary range penetration, equity usage trends, promotion budget tracking
-
Learning
training completion rates, identified skill gaps, program ROI measurements
-
Employee relations
case volume trends, average resolution time, policy violation patterns
Analytical dashboards: Unlimited metrics for specific investigations
Built for temporary, question-specific analysis. Why did engineering turnover spike in Q3? What's driving warehouse overtime increases? How does performance rating correlate with long-term retention?
Build them, extract insights, then archive them. Don't let temporary analysis become permanent maintenance burdens.
Making metrics auditable (the missing piece)
In finance, every number has a complete trail. Change a journal entry, it's automatically logged. Adjust a forecast, the documentation requirements are clear. Run a report from six months ago, you get identical results today.
HR metrics? Try explaining why last quarter's headcount was 1,247 when this quarter's historical view shows 1,251 for that same date. Someone "cleaned up" the data. Or adjusted the filters. Or decided contractors didn't count anymore. Good luck reconstructing the logic.
This isn't just frustrating—it's expensive. A healthcare company spent three months defending their turnover improvement to investors, only to discover that someone had accidentally excluded their highest-turnover facility from reports starting in Q2. The impressive "improvement" was actually a data collection error.
Making metrics auditable requires:
Version control on definitions When you modify how time-to-fill gets calculated, document the change date and business rationale. The previous method wasn't necessarily wrong—it measured something different. Maintain both calculations temporarily if needed, but label them clearly.
Snapshot reporting Save actual report outputs, not just the ability to regenerate them. Employee data changes constantly. People get reclassified. Termination dates get corrected for payroll purposes. The report you presented in January won't match the same query parameters run in June.
Change logs for critical metrics If headcount changes beyond normal hiring and turnover fluctuations, require explanatory notes. "Added 47 contractors converted to full-time status" prevents investigation into a perfectly explainable spike.
Clear data refresh schedules If your HRIS syncs with reporting tools daily at 2 AM, everyone needs to understand that Monday's 8 AM leadership meeting reflects Sunday's data snapshot. This sounds obvious until someone makes an urgent correction at 7:45 AM and wonders why the dashboard hasn't updated.
The implementation trap (and how to avoid it)
Most companies attempt building this entire system simultaneously. Six months later, they have beautiful documentation that nobody follows and dashboards that nobody trusts because the foundation was never solid.
Start with the single metric that causes the most organizational arguments. Usually headcount or turnover. Build the complete operational system for just that one metric:
-
Precise definition including edge cases
-
Single accountable owner
-
Documented data sources and calculation methods
-
Appropriate reporting cadence
-
Complete audit trail capability
Make that one metric completely boring and reliable. When leadership stops debating what the number means and starts discussing what actions to take based on it, add the next most problematic metric.
A logistics company applied this approach to time-to-fill after three consecutive quarters of heated disagreements about whether recruiting performance was improving or declining. They documented every decision point: requisition approval date (not initial request date), job posting date (not approval date), first interview scheduled, final interview completed, offer extended, offer accepted, actual start date. They selected "posting date to offer acceptance" as their primary metric because that represented what recruiting could directly control.
Within eight weeks, the arguments completely stopped. Time-to-fill became what it measured—some roles took longer based on market conditions and complexity, which was business reality rather than team performance. They could finally focus on which positions to prioritize and which sourcing channels delivered quality candidates fastest.
When good metrics decay
Even perfectly designed metrics systems deteriorate without active maintenance. New edge cases emerge as the business evolves. Strategic priorities shift. What seemed crucial last year becomes irrelevant or even counterproductive.
I watched a retail chain obsessively track "cost per hire" for three years after their CHRO read it was an essential metric. They optimized it down to $1,847 per hire, industry-leading performance. They also experienced 67% first-year turnover because they had optimized for hiring speed and cost rather than candidate quality and fit. The metric was technically perfect while being strategically destructive.
Prevent this drift through regular maintenance:
-
Quarterly definition reviews Do current definitions still match business reality? "Voluntary termination" means something entirely different during restructuring periods than during growth phases.
-
Annual relevance assessment Which metrics actually influenced decisions this year? Which generated reports that nobody read or acted upon? Eliminate the zombies consuming time and attention.
-
Post-crisis metric additions Every organizational crisis reveals a previously unmeasured risk. After discrimination lawsuits, you need diversity trend analysis. After competitor talent raids, you need retention risk indicators. Add these systematically, not reactively.
Prevent this drift through regular maintenance:
The compound effect of reliable metrics
A manufacturing company built their HR metrics operating system over 18 months. Nothing revolutionary—just consistent definitions, clear ownership, and regular reporting cycles. Year one involved mostly arguing about definitions and cleaning up historical data. Year two, patterns started emerging.
They noticed turnover consistently spiked exactly 90 days after organizational restructuring—not immediately, but like clockwork at the three-month mark. They began scheduling proactive retention conversations at day 60 post-reorganization. Turnover dropped by half.
They discovered time-to-fill correlated inversely with quality of hire, but only for senior-level positions. Junior roles could be filled quickly without quality degradation. They split their recruiting processes accordingly, saving weeks on entry-level hiring while maintaining rigor for leadership positions.
Most surprisingly, they found their highest performers were statistically more likely to leave after exactly two years, not their lowest performers as everyone assumed. Their entire retention strategy had been targeting the wrong population.
None of these insights required advanced analytics or machine learning models. They emerged from having consistent, reliable metrics that leadership actually trusted. When you stop debating what the numbers represent, you can start understanding what they reveal about organizational patterns.
Building your metrics operating system
The path from metric chaos to operational intelligence isn't about better technology. Most HRIS platforms can generate any report imaginable. The challenge is knowing what you actually need and ensuring everyone interprets it consistently.
Begin by auditing your current state. Which metrics do you genuinely use for decision-making? Not the ones in monthly reports that nobody reads—the numbers that actually change behavior. If turnover hits X threshold, you implement retention programs. If time-to-fill exceeds Y days, you adjust sourcing strategy.
Next, identify your biggest metrics pain point. Where do arguments consistently happen? What numbers get challenged in every leadership meeting? Which reports require three days to prepare because you're reconciling conflicting data sources?
Fix that single problem completely before addressing anything else.
Companies that succeed with this approach share three characteristics: They document obsessively (every definition, every calculation method, every edge case scenario). They assign unambiguous ownership (one person's name attached to each metric). They maintain proactively (quarterly reviews rather than annual overhauls).
They also shift from treating HR metrics as reporting obligations to treating them as operational intelligence systems. When you know precisely how long senior engineer hiring takes, you can begin recruiting before resignation letters arrive. When you can predict which high performers represent flight risks, you can address retention before they start interviewing elsewhere. When you understand the true cost of turnover for each role type, you can invest retention resources proportionally.
Start with one metric. Document it completely. Make it predictably boring. Then move to the next one. Within a year, you'll have something most companies never achieve: HR metrics you can actually trust to guide million-dollar talent decisions.
Ready to transform your HR processes?
Join thousands of HR teams using Hiryly to hire faster, engage employees better, and stay compliant effortlessly.