


A talent operations director showed me something a while back that genuinely changed how I think about DEI pipeline tracking. Their diversity metrics looked solid on paper—40% women in the applicant pool, decent representation across ethnicities. But when we mapped conversion rates by stage and source, a very different picture came through.
Women from employee referrals had a 62% phone screen pass rate. Women from job boards? 31%. Same qualifications on paper, wildly different outcomes. Nobody knew this was happening because they were averaging everything together in monthly diversity reports. This pattern shows up everywhere once you start looking. Companies track diversity percentages at each stage—applied, screened, interviewed, offered—but miss the conversion rate disparities that actually drive underrepresentation. You can have perfect diversity in your applicant pool and still end up with a homogeneous workforce if certain groups systematically convert at lower rates through your funnel.
Why traditional DEI metrics hide the real problems
Most HR teams measure diversity wrong. They count heads at each stage and call it a day. Applied: 45% women. Phone screen: 38% women. Onsite: 29% women. Hired: 22% women. The percentages decline, sure, but where exactly is the leak? Which transitions cause the drop? For which candidate segments?
It gets worse when you realize every funnel stage has multiple pathways. A phone screen rejection could mean the recruiter passed, the hiring manager declined, the candidate withdrew, or scheduling fell through. Each pathway might show different bias patterns, but lumping them together makes everything invisible.
Traditional diversity dashboards also ignore interaction effects. Maybe women convert fine through phone screens when the interviewer is female, but drop off with male interviewers. Or underrepresented minorities from certain universities sail through technical screens while those from state schools hit a wall. These patterns matter operationally, but standard DEI metrics miss them entirely.
Teams can spend months debating whether they have a "top of funnel" problem or a "conversion" problem when the real issue was something else entirely—like a technical assessment disproportionately filtering out candidates who learned to code through bootcamps rather than CS degrees, which correlates strongly with socioeconomic background.
Building a funnel attribution model that actually works
Effective DEI pipeline tracking starts with segmented conversion analysis, not aggregate percentages. Here's the framework that tends to work across different organizations.
Eliminate HR bottlenecks with smart automation.
Hiryly simplifies your HR operations so you can focus on people, not paperwork.
- Centralized candidate tracking
- Automated onboarding workflows
- Performance & compliance dashboards
No credit card required
First, map your actual funnel paths, not your idealized process. Most companies have at least three distinct paths: standard apply flow, employee referrals, and sourced candidates. Each needs separate tracking because they behave differently. Referrals might skip phone screens. Sourced candidates might get expedited interviews. These variations affect conversion rates and create attribution confusion if you don't account for them.
Next, establish cohort definitions that matter for your context. Gender and ethnicity are starting points, but consider intersections with source (referral vs. applied), education background (traditional vs. non-traditional), years of experience, and geography. The goal isn't to slice data into meaninglessness—it's to find the four or five segments where conversion patterns diverge most significantly.
Your attribution model needs three measurement layers:
Stage-to-stage conversion rates by segment. Not just "phone screen to onsite" but "recruiter phone screen pass to hiring manager phone screen scheduled" and "hiring manager phone screen complete to onsite invite sent." The more granular your stages, the more precisely you can identify leak points.
Time-in-stage analysis. Bias often shows up as delays, not just rejections. If certain groups consistently wait longer for interview scheduling or offer approvals, that's both an equity issue and a candidate experience problem. Track median days in each stage by segment.
Drop-off categorization. When candidates exit your funnel, record why: company rejected (and at what level), candidate withdrew (and their stated reason if known), or process failure (scheduling conflicts, no response, etc.). Different drop-off reasons point to different interventions.
The model should also track "near misses"—candidates who made it far but didn't convert. If underrepresented candidates consistently reach final rounds but lose at the last decision, that's a different problem than early-stage filtering.
Here’s a visual of the attribution workflow and measurement layers.
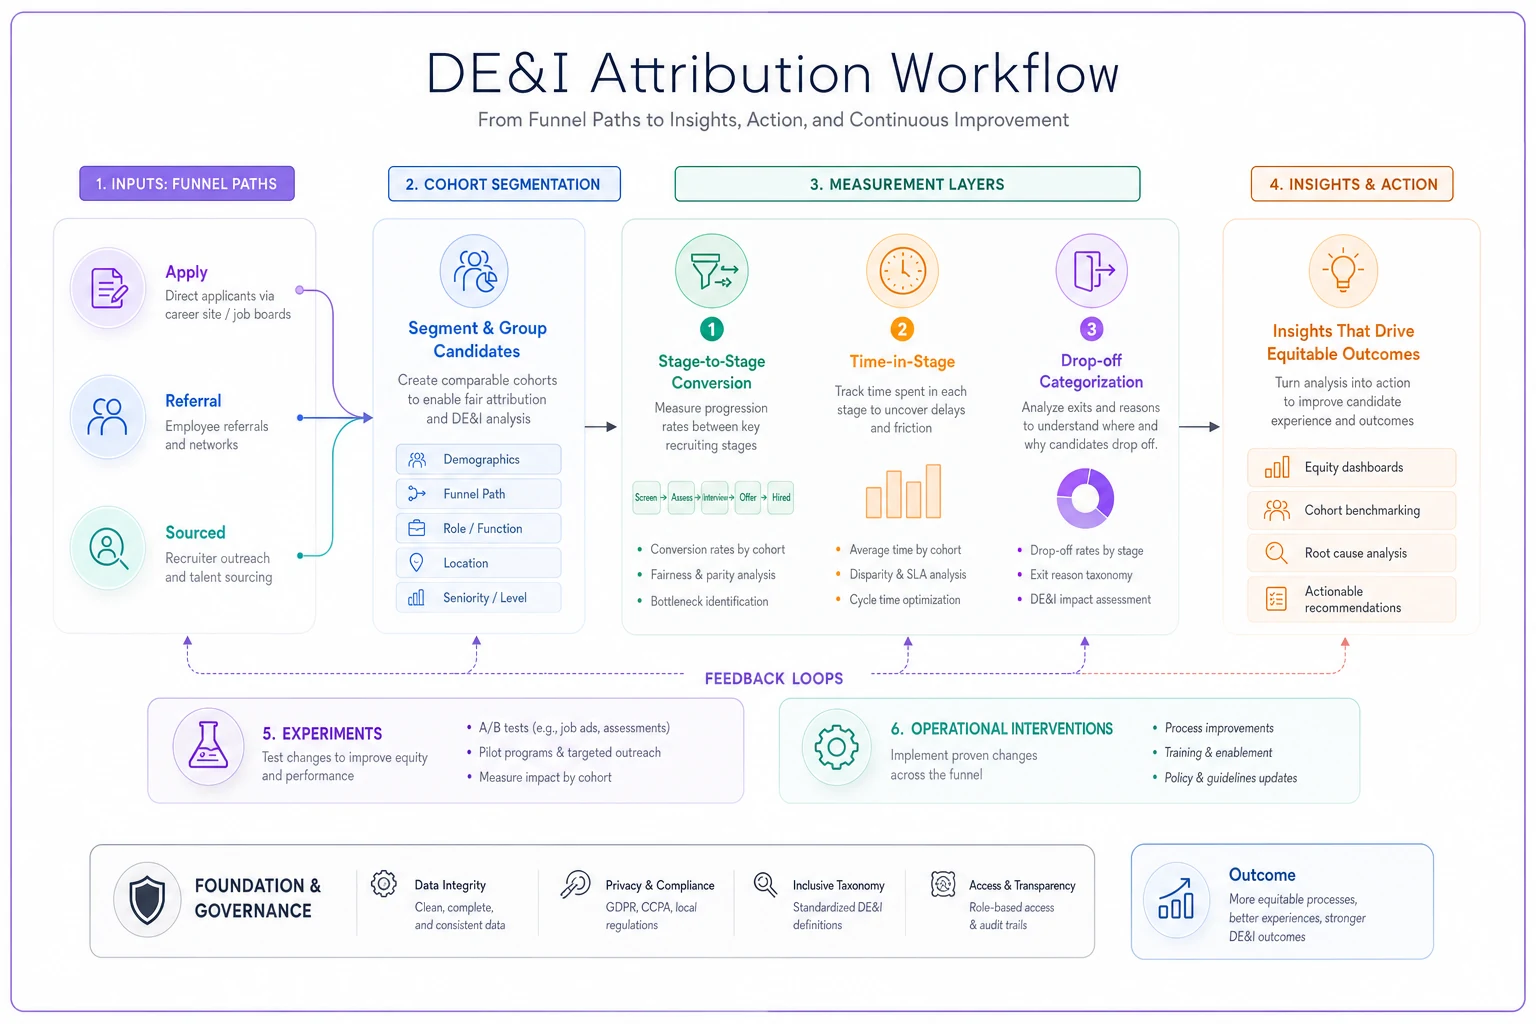
Use the workflow to map paths, define cohorts, and apply the three measurement layers to pinpoint leak points and design targeted tests.
Attribution techniques that reveal hidden bias patterns
Simple percentage comparisons rarely tell the full story. You need attribution methods that isolate variables and reveal causation, not just correlation.
Matched cohort analysis provides the clearest signal. Take candidates with similar profiles—same role, comparable experience, similar assessment scores—and compare conversion rates by demographic group. This controls for qualification differences and highlights bias effects in isolation. One tech company found their phone screen pass rates for women were around 18% lower than men even after controlling for years of experience, education, and coding assessment scores.
Interviewer fixed effects help identify individual bias patterns. Track each interviewer's historical pass rates by candidate demographic. Some interviewers show no meaningful variance. Others consistently rate certain groups lower. This isn't about assigning blame—it's about targeted coaching and process improvements. Sometimes the "bias" turns out to be inconsistent rubric application that training can fix.
Source channel attribution separates systemic issues from sourcing problems. If women from employee referrals convert well but women from LinkedIn poorly, you might have an assessment bias against candidates without insider context. Or your referral network might be recommending stronger female candidates on average. Either way, the attribution helps focus interventions.
Sequential decision analysis examines how earlier funnel decisions influence later ones. Do phone screen notes mentioning "culture fit" correlate with lower onsite conversion for certain groups? Do candidates who barely pass technical screens face a higher bar in behavioral rounds? These patterns often reveal how benefit-of-the-doubt gets distributed unevenly.
For organizations with enough volume, regression discontinuity analysis around assessment thresholds is worth exploring. If you require a minimum coding score of 70, compare outcomes for candidates scoring 68-72. In theory, these candidates are similarly qualified. In practice, who gets the "close enough" exception often follows demographic patterns.
Small experiments that move the needle without disrupting operations
The advantage of funnel experiments is that you can test interventions at single stages without overhauling your entire process. A few that consistently generate useful signal:
Experiment 1: Structured interview shadowing
Instead of having junior interviewers shadow randomly, create matched pairs where they shadow interviews for both majority and underrepresented candidates in the same role. Track their independent scores versus the lead interviewer's scores.
Measurement: Compare score divergence patterns. Do shadows rate underrepresented candidates lower than leads do? This reveals both bias patterns and calibration gaps.
Implementation: Run for 20-30 interviews per shadow. Takes about two weeks for active recruiters.
Experiment 2: Blind resume review sampling
Take 50 recent applications that received phone screens and 50 that didn't. Strip identifying information—names, schools, graduation years. Have a different recruiter re-evaluate them blindly.
Measurement: How often does the blind review disagree with the original decision? Is the disagreement rate higher for certain demographic groups? This quantifies how much demographic information influences initial screening.
Implementation: Two hours of recruiter time, once per quarter. Provides ongoing bias monitoring without much overhead.
Experiment 3: Interview question rotation
Instead of asking all behavioral questions to all candidates, randomly assign three from a bank of six validated questions. This prevents certain questions from systematically disadvantaging groups while maintaining consistency.
Measurement: Track pass rates by question combination and demographic. Do certain questions correlate with disparate outcomes? Some questions accidentally test for majority-culture knowledge rather than job skills.
Implementation: Requires question bank development (one-time effort) and basic randomization in your ATS or interview kit.
Experiment 4: Calibrated reference checks
Create a structured reference check template with specific, behavior-based questions. Randomly assign half of final-stage candidates to receive structured checks, half to receive traditional conversational checks.
Measurement: Compare offer rates and quality of hire metrics six months later. Structured checks often reduce bias in final decisions without sacrificing hire quality.
Implementation: Design template (roughly 2 hours), train recruiters (1 hour), run for 30-40 final-stage candidates.
Measurement plans that don't require a data science degree
Your measurement plan needs to balance rigor with practicality. Most HR teams don't have dedicated analysts, so the tracking system has to be maintainable with basic Excel skills.
Start with a simple funnel tracking template:
| Stage | Total | Women | URM | Women Pass % | URM Pass % | Overall Pass % | W Delta | URM Delta |
|---|---|---|---|---|---|---|---|---|
| Applied | 850 | 340 | 255 | - | - | - | - | - |
| Phone Screen | 170 | 61 | 38 | 17.9% | 14.9% | 20% | -2.1% | -5.1% |
| Technical | 68 | 22 | 13 | 36.1% | 34.2% | 40% | -3.9% | -5.8% |
| Onsite | 24 | 6 | 3 | 27.3% | 23.1% | 35.3% | -8% | -12.2% |
| Offer | 8 | 1 | 1 | 16.7% | 33.3% | 33.3% | -16.6% | 0% |
This basic template immediately shows where conversion gaps emerge. The "Delta" columns highlight where certain groups underperform relative to the overall population—those become your intervention priorities.
For time-based analysis, add columns for "Median Days in Stage" by segment. You don't need complex statistics—just Excel's MEDIAN function grouped by demographic categories.
-
Primary metric
Offer acceptance rate by demographic group
-
Leading indicator
Phone screen to onsite conversion by source and demographic
-
Process metric
Average days from application to decision
-
Diagnostic metric
Interviewer pass rate variance by demographic
Pick metrics you'll actually track. Three reliable metrics beat twenty sporadic ones.
When interventions backfire: patterns to avoid
Not all DEI interventions help. Some actively harm both diversity and hiring quality.
The quota trap: Setting hard diversity targets for each funnel stage seems logical but creates perverse incentives. Recruiters might advance underqualified diverse candidates to hit numbers, setting them up to fail in later rounds. This damages individual candidates and program credibility. Better approach: Set conversion rate parity goals, not absolute number targets.
The training overload: Mandatory unconscious bias training for all interviewers feels productive but rarely changes behavior. Research consistently shows one-time training doesn't stick. Better approach: Embed bias interruptions in the process itself—structured rubrics, diverse interview panels, specific behavioral anchors for ratings.
The overcorrection problem: Some teams swing from "no DEI focus" to "DEI explains everything" and attribute all disparities to bias, ignoring legitimate factors like experience gaps or geographic constraints. This alienates hiring managers and prevents addressing real structural issues. Better approach: Acknowledge multifactor causation while still addressing bias where it clearly exists.
The visibility paradox: Highlighting diversity candidates to interviewers ("this candidate adds diversity") can trigger stereotype threat and actually reduce their performance. Better approach: Focus on process changes that help all candidates while disproportionately benefiting underrepresented groups.
Turning attribution insights into operational changes
Data without action is just expensive reporting. Your attribution model should directly inform process improvements.
-
Phone screen disparities Standardize the first 10 minutes with identical opening questions. Create a rubric with specific indicators for each rating level. Require recording of actual candidate responses, not just impressions.
-
Technical assessment gaps Offer practice problems in advance. Allow candidates to choose from multiple problem types. Provide explicit rubrics showing what "meets bar" performance actually looks like.
-
Onsite conversion issues Implement panel debriefs where each interviewer shares feedback before hearing others' views. Require evidence-based feedback tied to specific moments or responses. Use a champion/concern format rather than yes/no votes.
-
Offer decline patterns Analyze compensation equity before making offers. Share diversity statistics and ERG information during recruiting. Connect candidates with employees from similar backgrounds.
The operational key is making these changes feel natural, not forced. Structured interviews shouldn't feel robotic. Rubrics should guide rather than constrain. The goal is reducing variance and subjectivity while preserving human judgment where it matters.
AI-powered operational software can quietly support this work—automatically flagging when certain interviewers' scores deviate from team norms, or when specific funnel stages show unusual conversion patterns for certain groups. The system prompts for additional review without making accusations, turning bias detection into a quality control process rather than a blame exercise.
Building coalitions for sustainable change
DEI pipeline improvements require buy-in beyond HR. Here's how to build support across different stakeholders:
For skeptical executives: Frame disparate conversion rates as operational inefficiency. You're losing qualified candidates due to process inconsistency. Show the cost of replacement hires when underrepresented employees leave within a year.
For resistant hiring managers: Position structured interviews as lawsuit prevention and better hiring decisions overall. Share data showing structured processes reduce bad hires across all demographics, not just diverse candidates.
For overwhelmed recruiters: Emphasize that attribution modeling helps them work smarter. Instead of sourcing more diverse candidates who won't convert, they can focus on fixing the stages that actually cause drop-off.
For nervous interviewers: Make it about skill development, not judgment. "Our data shows certain interview approaches work better for assessing all candidates. Let's help you master those techniques."
The coalition-building often matters more than the technical attribution model itself. A simple but supported intervention beats a sophisticated but ignored analysis every time.
Progress through precision
Most organizations approach DEI pipeline tracking backwards. They set diversity goals, implement broad training programs, then wonder why the numbers don't move. The attribution approach flips this: identify specific leak points, test targeted interventions, then scale what works.
You don't need perfect data or a dedicated analyst to start. Begin with basic conversion tracking by demographic group. Add one attribution technique—maybe interviewer effects or source channel analysis. Run one small experiment. Build from there.
The companies making real progress on representation aren't necessarily the ones with the biggest DEI budgets. They're the ones who know exactly where their funnel breaks down and fix each leak point methodically—treating pipeline tracking like any other operational problem: measure, attribute, test, improve, repeat.
Every small improvement in conversion rates compounds over time. Fix enough leak points and your pipeline eventually flows the way it should—surfacing the best talent regardless of background. And behind every attribution metric is a real person trying to build their career. Get the attribution right, and you're not just improving a dashboard—you're creating opportunities that wouldn't have existed otherwise.
Ready to transform your HR processes?
Join thousands of HR teams using Hiryly to hire faster, engage employees better, and stay compliant effortlessly.