


Most HR teams run workforce planning like they're managing a static spreadsheet instead of a living operation. They build annual headcount budgets in October, lock them in January, then spend the rest of the year firefighting when reality doesn't match the plan.
The core problem isn't the math or the templates. It's that traditional workforce planning treats demand as an annual assumption rather than a quarterly reality that needs constant recalibration.
Why Traditional Workforce Planning Breaks at the Demand-Supply Junction
Every workforce planning model shares the same structural weakness: demand signals get separated from supply decisions by too many layers and too much time.
Finance owns the budget. Business units own the headcount requests. HR owns the recruiting pipeline. Operations owns the actual work demand. Each group runs on different timelines with different metrics, and by the time alignment happens, the original demand signal has already shifted.
A mid-size logistics company ran into this hard. Their annual plan assumed steady 15% growth across all regions. By Q2, the Northeast was actually growing at over 30% while the Southwest had started contracting. But because their model only allowed annual adjustments, they kept hiring for the Southwest while Northeast operations burned through the existing team.
The cost wasn't just overtime and turnover. Customer satisfaction in the Northeast dropped significantly, and the Southwest had people sitting idle. When you add up the productivity loss and churn, it gets expensive fast — the kind of operational damage that doesn't show up cleanly on a P&L but everyone feels.
Building a Systems-First Quarterly Forecasting Process
A functional workforce planning operating model starts with accepting that demand changes faster than annual cycles can accommodate. Quarterly recalibration needs to be built into the system itself, not treated as an exception process.
Eliminate HR bottlenecks with smart automation.
Hiryly simplifies your HR operations so you can focus on people, not paperwork.
- Centralized candidate tracking
- Automated onboarding workflows
- Performance & compliance dashboards
No credit card required
Start with demand-to-supply mapping at the operational level — connecting actual workload indicators to headcount needs before they become crises.
For a 200-person professional services firm, three leading indicators drove the quarterly forecast:
-
Pipeline velocity (deals moving from proposal to signed)
-
Project complexity scores (hours per deliverable type)
-
Client expansion signals (upsell conversations logged in CRM)
These indicators translated operational demand into specific role requirements. Not generic headcount numbers — actual positions tied to actual work.
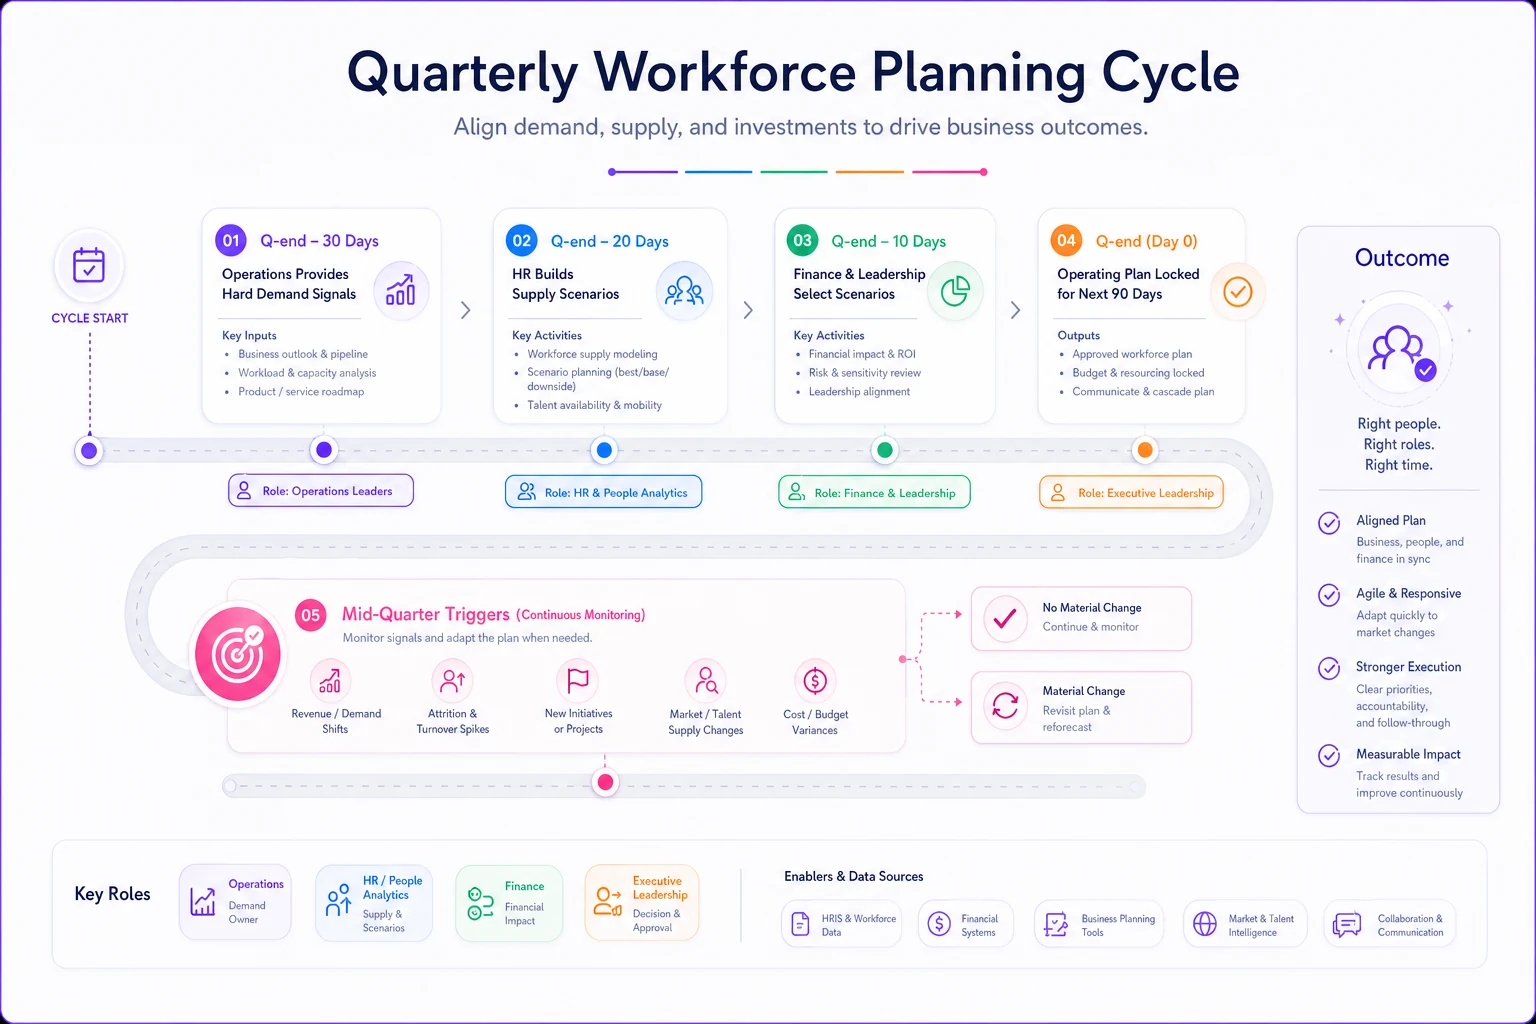
QUARTERLY WORKFORCE PLANNING CYCLE Q-end minus 30 days [Operations: Hard demand signals] | v Q-end minus 20 days [HR: Supply scenarios built] | v Q-end minus 10 days [Finance + Leadership: Scenario selection] | v Q-end [Operating plan locked for next 90 days] | v Mid-quarter triggers monitored continuously
Quarter-end minus 30 days: Operations provides updated demand signals. Not a wishlist or a negotiation starting point — hard data on contracted work, pipeline probability, and capacity utilization.
Quarter-end minus 20 days: HR translates demand into supply scenarios. Not just "we need 5 more people" but specific scenarios showing what happens with different hiring velocities and internal mobility options.
Quarter-end minus 10 days: Finance and leadership review scenarios against budget constraints and strategic priorities. They don't just approve or deny — they select from pre-built scenarios with documented trade-offs.
Quarter-end: The selected scenario becomes the operating plan for the next 90 days, with specific triggers defined for mid-quarter adjustments.
Visualizing this cycle helps clarify responsibilities and timing.
Mid-quarter triggers monitored continuously
Headcount Scenario Templates That Actually Work
Most scenario planning fails because it presents false choices. "Do you want growth or stability?" isn't a real scenario. Real scenarios show operational trade-offs with specific consequences.
Freeze Scenario Template
A freeze scenario isn't just "stop hiring." It maps out what actually breaks if you do:
Operational Coverage:
-
Which deliverables get delayed
-
Which clients face extended response times
-
What work gets declined or deferred
-
Internal project impacts
Risk Thresholds:
-
Overtime hours before burnout risk
-
Customer satisfaction score minimums
-
Quality metric boundaries
-
Compliance staffing requirements
Trigger Points:
-
Specific metrics that force reconsideration
-
Emergency hiring protocols
-
Contractor activation thresholds
-
Work redistribution rules
One software company worked through this exercise and realized their freeze scenario could probably hold for around 10 weeks before hitting critical service levels — but only if three specific conditions stayed intact. That kind of clarity changed the whole conversation. Instead of "we can't freeze hiring," leadership was actually debating whether those conditions were realistic.
Growth Scenario Template
Growth scenarios need equal detail but different focus:
Ramp Assumptions:
-
Time to productivity by role
-
Training capacity constraints
-
Onboarding resource requirements
-
System and workspace readiness
Investment Staging:
-
Which roles hire first
-
Geographic or departmental sequencing
-
Internal promotion timing
-
Contractor-to-permanent conversions
Capacity Checkpoints:
-
Manager span of control limits
-
Training bottlenecks
-
System user licenses
-
Physical workspace availability
The template forces thinking beyond headcount to actual operational capacity. Can your current managers effectively onboard 20% more direct reports? Do you have enough senior staff to train juniors? These constraints often matter more than budget.
Capacity Heatmaps and Decision Thresholds
Static org charts tell you structure. Capacity heatmaps show you pressure points.
A useful heatmap tracks three dimensions:
-
Current utilization (how busy people actually are)
-
Skill coverage (who can do what)
-
Growth capacity (how much more each area can absorb)
Build it quarterly, not annually. Color-code by threshold:
-
Green 60–75% utilized, full skill coverage, can absorb roughly 20% more work
-
Yellow 75–85% utilized, partial skill gaps, can absorb around 10% more work
-
Red Over 85% utilized, critical skill gaps, can't absorb more work
The heatmap alone doesn't drive decisions though. You need clear thresholds tied to actions.
| Metric | Green Zone | Yellow Zone | Red Zone | Action Required |
|---|---|---|---|---|
| Team Utilization | 60-75% | 75-85% | >85% | Red: Immediate hiring or work redistribution |
| Skill Coverage | 3+ qualified | 2 qualified | 1 qualified | Red: Training plan or external hiring within 30 days |
| Overtime Hours | <5/week | 5-10/week | >10/week | Yellow: Review workload distribution weekly |
| Customer Response Time | <24 hours | 24-48 hours | >48 hours | Yellow: Implement triage system |
| Project Delays | None | 1-2 minor | Any major | Red: Executive review within 48 hours |
These thresholds connect to budget owner accountability. When a metric hits yellow, the budget owner presents a mitigation plan within 5 business days. Red zones trigger immediate escalation and predetermined response protocols. The threshold matrix only works if people actually know what they're supposed to do when a number turns red — which is why the action column matters as much as the zones themselves.
Connecting Budget Owners to OKRs Through Workforce Decisions
The biggest gap in most workforce planning models is the disconnect between workforce decisions and actual business objectives. Budget owners make headcount requests based on departmental needs, not company OKRs.
Instead of: "Marketing needs 2 more content creators"
Required format: "Adding 2 content creators will increase organic traffic by roughly 40% (OKR: Grow organic pipeline 50% by Q4), based on current creator output and average traffic growth per piece."
This forces three connections that actually matter:
Connection 1: Role to Result Each position must show direct linkage to measurable outcomes — not vague productivity improvements, but specific metrics that ladder up to OKRs.
Connection 2: Timing to Target When does the role need to start to impact the OKR timeline? A Q4 target might require Q2 hiring once you factor in ramp time.
Connection 3: Alternative to Achievement What other ways could this OKR get hit? Could contractors work? Could automation help? Could a process change deliver the same result?
Budget owners who can't make these connections don't get approval. It's not bureaucracy — it's operational discipline that keeps workforce investments tied to real business outcomes.
A Practical Workbook for Implementation
Theory without templates is just good intentions. The simplest version of this that actually works is a five-tab workbook — not fancy, but it covers the ground that matters.
-
Tab 1
Demand Signals
pulls together revenue pipeline by month, customer growth projections, product launch timelines, and any seasonal patterns worth tracking. -
Tab 2
Work Translation
is where you do the conversion — revenue to workload, customers to support ratios, projects to resource estimates. This is usually the tab that exposes the most uncomfortable gaps. -
Tab 3
Supply Inventory
covers current headcount by role, utilization rates, skill matrices, internal mobility candidates, contractor capacity, and where the hiring pipeline actually stands. -
Tab 4
Gap Analysis
compares demand to supply, maps timing, and — critically — starts estimating the cost of gaps. Overtime costs, project delays, quality impacts. This forces the conversation about what doing nothing actually costs. -
Tab 5
Scenario Builder
runs the three or four options leadership needs to choose between: baseline, conservative growth, more aggressive growth, freeze with exceptions, or whatever mix fits the situation. Each scenario includes rough monthly cash flow impact and an honest risk score.
Run the workbook in one department first to validate your work-translation assumptions before scaling.
Is this workbook perfect? No. The work translation tab in particular requires a lot of judgment calls, and early versions of it are usually pretty rough.
But rough and used beats polished and ignored.
Making the Model Stick: Governance and Cadence
A workforce planning model fails without governance. You need clear ownership, a regular cadence, and documented decisions.
Quarterly Planning Cadence:
-
Month 1 of Quarter
- Week 1–2: Execute current plan - Week 3: Collect early demand signals - Week 4: Initial supply assessment
-
Month 2 of Quarter
- Week 1: Demand forecast draft - Week 2: Supply scenario building - Week 3: Stakeholder input sessions - Week 4: Scenario refinement
-
Month 3 of Quarter
- Week 1: Final scenarios to leadership - Week 2: Decision and communication - Week 3: Implementation planning - Week 4: Next quarter prep begins
This means you're never more than 4 weeks from a meaningful adjustment, but you're also not trapped in constant replanning mode.
Governance Structure:
The Workforce Planning Committee meets monthly. Members include:
-
HR operations lead (runs the process)
-
Finance business partner (owns budget impact)
-
Operations representative (provides demand signals)
-
One rotating business unit leader (brings field perspective)
Each session has a specific decision agenda:
-
Month 1
Review execution against plan
-
Month 2
Validate demand forecasts
-
Month 3
Approve scenario selection
Between meetings, a simple RACI keeps things moving:
-
Responsible HR operations for process execution
-
Accountable CFO for budget alignment
-
Consulted Business unit leaders for demand input
-
Informed All managers for implementation
The committee structure looks heavier than it is in practice. Most sessions run under an hour when the underlying data is clean and everyone shows up having actually reviewed it.
Common Failure Points and How to Avoid Them
Failure Point 1: Demand Signals Too Vague
Most demand forecasts say things like "we expect growth" or "things might slow down." That's not actionable. Require specifics: "Sales pipeline shows a meaningful increase in qualified opportunities, requiring approximately 8 more implementation hours per $100k of revenue based on historical ratios."
If departments can't provide specific signals, use proxy metrics. Customer support tickets, sales activities, project milestones — anything that correlates with workload.
Failure Point 2: Scenarios Without Trade-offs
Every scenario should hurt somewhere. If choosing between scenarios feels easy, they're not real scenarios.
-
Freeze
Save significant quarterly spend but risk losing major clients due to capacity constraints
-
Moderate growth
Maintain service levels, delay new product launch by several weeks
-
Aggressive growth
Accelerate all initiatives, risk quality issues during ramp
When trade-offs are visible, decisions become strategic rather than political.
Failure Point 3: OKR Linkage Gets Abandoned
It's easy to start with strong intentions about tying headcount to OKRs, then drop it when urgency hits. Build the linkage into approval templates so it can't be skipped. No linkage means no approval, no exceptions.
Failure Point 4: Mid-Quarter Adjustments Become Chaos
You need triggers for mid-quarter adjustments, but you also need limits. Otherwise continuous replanning destroys team productivity.
-
Customer loss above a meaningful threshold of revenue
-
New contract adding substantially to capacity
-
Attrition spike well above normal rate
-
Regulatory change affecting operations
Without a documented trigger, no mid-quarter changes. This forces discipline while leaving room for real crises. It also protects the team from leaders who want to reopen planning conversations every time the market moves slightly.
Technology and Automation in Modern Workforce Planning
The complexity of quarterly workforce planning genuinely demands more than spreadsheets at some point. The manual version works when you're doing this across three or four departments. When you're running it across fifteen, the lag between demand signals and hiring decisions starts to compound.
This is where proper HR metrics infrastructure becomes critical. Your workforce planning model is only as good as the data feeding it.
AI-powered operational software can shift workforce planning from reactive to predictive. Instead of waiting for quarterly reviews, these platforms monitor demand signals continuously, flag capacity risks early, and surface optimal hiring timing before the problem becomes visible. One practical example: a platform might detect that customer support ticket volume correlates with new product launches with a multi-week lag, then automatically adjust workforce recommendations when launches are scheduled — before the ticket spike actually hits.
Scenario modeling also gets faster. Rather than manually building options in spreadsheets, the platform generates multiple scenarios across different constraint combinations and optimizes based on your actual priorities. The less glamorous benefit is that automation enforces the governance requirements that humans tend to skip when things get busy. Every headcount request maps to OKRs. Every scenario includes trade-offs. Every decision gets documented. The system doesn't let you take the shortcuts that quietly undermine the whole operating model.
Connecting this to broader hiring governance frameworks ensures that once headcount is approved, execution follows with appropriate urgency levels and predefined success metrics already attached.
Building Your Implementation Roadmap
Start small. Don't try to implement a full quarterly forecasting system in one shot.
-
Quarter 1
Foundation
Build the demand signal collection process. Getting clean, consistent demand data out of operations is often the hardest part. Focus on 2–3 key departments first. -
Quarter 2
Scenarios
Add scenario planning for those initial departments. Create simple freeze vs. growth options. Document what actually happens versus what the scenarios predicted. -
Quarter 3
Expansion
Extend to all departments. Add capacity heatmaps. Introduce the governance committee structure. -
Quarter 4
Optimization
Add OKR linkage requirements. Implement decision thresholds. Evaluate technology platforms for automation.
Each quarter, measure the gap between planned and actual headcount outcomes. A mature workforce planning model should predict somewhere around 80–85% of hiring needs accurately at the quarterly level — not perfectly, but well enough to eliminate most of the firefighting.
Track these metrics to demonstrate value:
-
Time from demand signal to hiring decision (target
under 20 days)
-
Percentage of emergency hires (target
under 10%)
-
Utilization rate variance (target
within roughly 5% of plan)
-
OKR achievement rate for positions hired (target
above 70%)
These numbers won't look great in the first cycle. That's expected. The goal in year one is establishing the baseline — knowing what your current emergency hire rate actually is, or how long decisions really take, is genuinely useful before you start optimizing anything.
The Competitive Advantage of Quarterly Calibration
Companies that get workforce planning right gain real operational advantage. They're not constantly in crisis mode. They're not choosing between growth and burnout. They're making deliberate trade-offs with clear understanding of consequences.
The quarterly cadence feels like overhead at first. It's far less disruptive than emergency hiring cycles or painful layoffs though. Small, regular adjustments beat violent corrections that throw everyone off balance.
Most importantly, it connects workforce decisions to business outcomes in a way that annual planning genuinely can't. When every headcount decision ties to specific OKRs with measurable impact, you stop treating people as costs and start treating them as investments with expected returns. That shift — from headcount management to workforce optimization — is what moves HR from a support function to something that actually drives business results.
Most importantly, it connects workforce decisions to business outcomes in a way that annual planning genuinely can't. When every headcount decision ties to specific OKRs with measurable impact, you stop treating people as costs and start treating them as investments with expected returns. That shift — from headcount management to workforce optimization — is what moves HR from a support function to something that actually drives business results.
Ready to transform your HR processes?
Join thousands of HR teams using Hiryly to hire faster, engage employees better, and stay compliant effortlessly.