

Most employer-brand work falls apart at the same seam: somebody produces a batch of content—culture videos, a careers page refresh, a LinkedIn series, a Glassdoor response strategy—and none of it is wired to anything measurable downstream. The assets exist. The funnel exists. But there's no connective tissue between them. So when a CFO asks why you spent the money, the honest answer is a shrug and a slide with impressions on it.
That gap isn't a creative problem. It's an operating-model problem. You're producing artifacts without a map of where each one is supposed to fire in the candidate journey, who owns it, what it's supposed to move, and how you'll know if it did. The brand team ships, the recruiting team sources, and the two functions wave at each other across a wall.
This piece is about closing that wall—not with a bigger content calendar, but with an operating model that treats employer-brand assets as inputs into specific funnel touchpoints, each with an owner, a channel, a cost, and a measurable outcome tied back to time-to-fill and quality-of-hire.
Why the brand-to-funnel disconnect is almost universal
The structural reason is ownership. Employer brand usually lives with marketing, talent attraction, or a comms person who reports somewhere strange. The hiring funnel lives with recruiters and hiring managers. These groups run on different calendars, different metrics, and different definitions of "done."
Marketing measures reach and engagement. Recruiting measures fill rate and speed. Neither group is incentivized to close the loop, because closing the loop means one of them has to adopt the other's metric as their own. In practice, this usually surfaces when a new EVP gets launched: a lot of energy, a microsite, a hashtag, maybe an agency. Six months later nobody can tell you whether a single hire came through any differently because of it.
There's a second reason, and it's quieter. Most brand artifacts aren't built for a stage. A "day in the life" video gets dropped on the careers page, posted on LinkedIn, and emailed to a talent community—three completely different touchpoints with three completely different jobs. On the careers page it's trying to convert a warm visitor. On LinkedIn it's trying to interrupt a passive candidate. In a nurture email it's trying to re-warm someone who went cold. Same asset, three intents, zero differentiation in how success gets judged.
When you don't map artifacts to touchpoints, you can't attribute anything. Which means you can't improve anything. Which means next year's brand budget gets defended with vibes.
What breaks as you scale
At 20 hires a year, you can get away with that. One recruiter knows every candidate, the brand is basically the founder's personality, and attribution lives in somebody's head. The system is informal but functional because the whole operation fits in a single person's memory.
Eliminate HR bottlenecks with smart automation.
Hiryly simplifies your HR operations so you can focus on people, not paperwork.
- Centralized candidate tracking
- Automated onboarding workflows
- Performance & compliance dashboards
No credit card required
-
Channel overlap goes invisible. You're paying for a job board, running LinkedIn ads, funding an employee-referral bonus, and sponsoring a meetup—and three of those are reaching the same 400 people. Without channel-level attribution, you keep paying for all four.
-
Asset rot. The culture video from two reorgs ago is still the hero asset on the careers page. Nobody owns retiring it. Candidates watch it, join, and immediately feel the gap between the pitch and reality—which quietly feeds early attrition.
-
Touchpoint gaps. You have great top-of-funnel content and nothing for the "I applied and heard nothing for nine days" stage, which is exactly where strong candidates ghost.
-
Spend that can't be defended. Finance sees a line item. You see brand equity. Nobody sees a number connecting the two, so the budget gets cut the first time hiring slows.
The common thread is coordination debt. Every artifact, channel, and stage was added one at a time by whoever needed it that quarter, and nobody ever stepped back to draw the full map. The operating model is the thing that draws the map and keeps it current.
The four components of an employer-brand operating model
A working model has four moving parts that need to connect to each other. Miss one and the others leak.
1. The artifact-to-touchpoint map
This is the backbone. You list every brand artifact you own, then assign each one to the specific funnel touchpoint it's meant to influence, the intent at that stage, and the owner responsible for keeping it alive.
| Artifact | Funnel touchpoint | Primary intent | Owner | Refresh cadence |
|---|---|---|---|---|
| EVP one-pager | Job ad + careers page | Convert interest to apply | Talent attraction | Annual |
| "Day in the life" video | LinkedIn / passive outreach | Interrupt & warm | Brand | Every 6–9 months |
| Hiring-manager intro video | Post-apply email | Reduce ghosting pre-screen | Recruiter | Per-role |
| Glassdoor response templates | Reputation / consideration | Reduce drop at research stage | Comms | Quarterly review |
| Team/project case stories | Onsite interview prep pack | Lift offer-accept rate | Brand + hiring mgr | Twice a year |
| Referral toolkit | Employee-referral channel | Expand warm pipeline | Talent attraction | Quarterly |
The point of the map isn't tidiness. It's that every artifact now has a stage, a job, and a name attached to it. When something underperforms, you know what to pull and who to call.
2. Channel ROI templates
Each channel needs a consistent way to express cost against outcome, or you can't compare them honestly. The template doesn't need to be elaborate—it needs to be the same for every channel so the numbers hold up.
A usable channel template captures:
-
Spend (cash + loaded internal hours)
-
Applies generated attributable to the channel
-
Qualified-to-apply ratio (so volume doesn't fool you)
-
Hires sourced
-
Cost per qualified applicant and cost per hire
-
Average time-to-fill for roles sourced through it
-
A quality-of-hire read once there's enough tenure to measure
The template matters more than the tooling. What tends to happen is that teams obsess over the dashboard and skip the definitions—so "applies" means something different on each channel and the comparison falls apart. Nail the definitions first. Getting your metric taxonomy and data ownership right is its own discipline, and it's worth reading through how an HR metrics operating system makes KPIs reliable before you build ROI templates on top of shaky foundations.
3. The experiment calendar
Brand work drifts into "we'll just keep producing stuff" unless you impose a test cadence. The experiment calendar schedules deliberate changes—one variable at a time—against a defined metric and a defined window.
A simple quarterly rhythm:
-
Pick one touchpoint that's leaking (say, the post-apply stage where 30% go cold).
-
Form one hypothesis ("a hiring-manager intro video in the confirmation email reduces pre-screen ghosting").
-
Define the metric and window (pre-screen show-rate, measured over the next ~40 applicants).
-
Run it clean—don't change three things at once.
-
Read, keep or kill, document in the map so the next person inherits the finding.
If you want a structured approach to generating and measuring these without over-engineering it, the framework in low-effort HR experiments to lift quality-of-hire in 60 days translates almost directly to brand-asset testing. The discipline is the same: small hypotheses, honest measurement, no hero projects.
4. The spend-to-outcome dashboard
This is where the three previous parts resolve into something a finance partner will actually respect. The dashboard ties channel and artifact spend to two outcomes leadership already cares about: time-to-fill and quality-of-hire.
The non-obvious part is the lag. Brand investments pay off on a delay—a video you post in March might be why a candidate accepts in July. A dashboard that only shows this-month spend against this-month hires will make your best long-term assets look worthless. Build it to show cohorts: candidates who entered the funnel in a given window, and what it eventually cost to convert and retain them.
Here's a simple visual of how those components fit together.
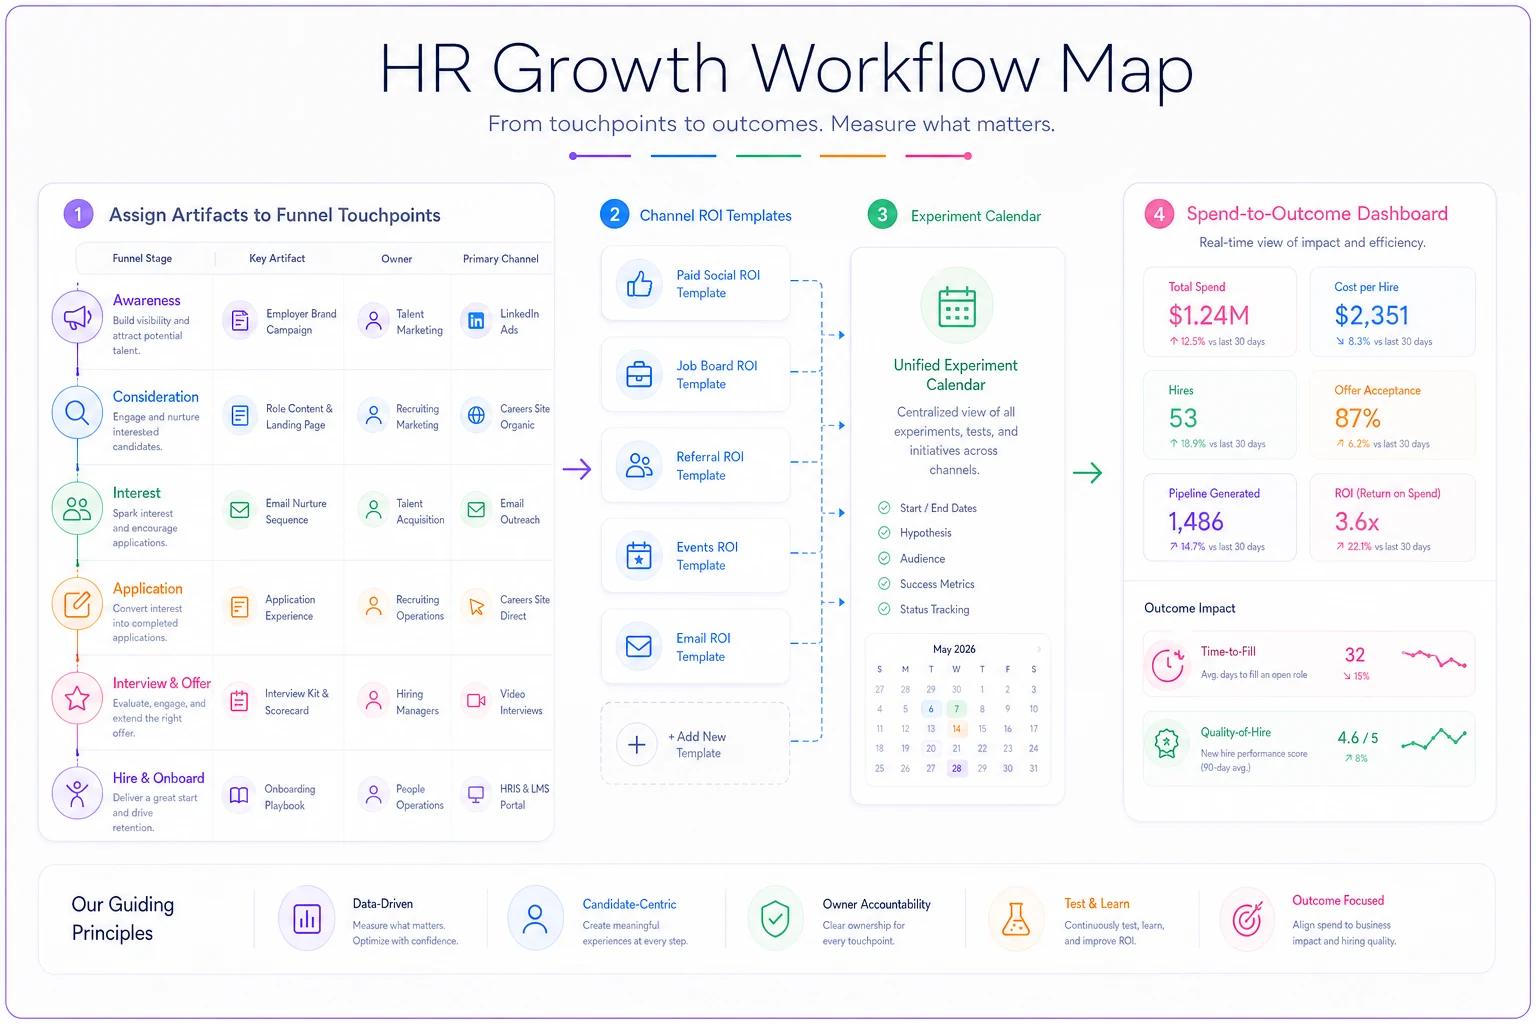
This sketch shows how artifacts, channels, experiments, and the dashboard form a single loop of ownership and measurement.
A text walkthrough of how the pieces move together
Here's the workflow when the model is running properly.
A role opens. The recruiter pulls the artifact-to-touchpoint map and assembles the stage-specific assets: EVP one-pager into the job ad, a current team story for the interview prep pack, the hiring-manager intro queued for the post-apply email. No scrambling, no "can someone send me the good video."
The role goes live across chosen channels, each already instrumented with the same ROI template. As candidates move, the dashboard accrues cost and outcome data per channel and per artifact touchpoint. If the post-apply stage is where this quarter's experiment lives, the recruiter runs the test condition and the calendar tracks it.
Four weeks in, the dashboard shows the referral channel producing roughly half the qualified applicants at a third of the cost of the paid board, while the board is faster to volume but weaker on quality-of-hire at the 90-day mark. That's a reallocation decision you can make with a straight face. The map tells you which artifact drove the referral surge; the ROI template tells you it was cheaper; the dashboard tells you it held up on quality.
The feedback loops back into the map. A video that's clearly converting gets a longer refresh runway. One that nobody watches gets retired instead of quietly rotting on the careers page. This is also where talent-supply orchestration across sourcing and internal mobility becomes relevant—your brand channels aren't the only supply source, and the operating model should see external brand-driven pipeline and internal movement in the same frame rather than optimizing one while starving the other.
A real scenario
A mid-market healthcare staffing company—around 140 hires a year, split across clinical and back-office roles—had a careers page refresh and a LinkedIn content push but no attribution connecting either to actual hiring outcomes. Brand spend ran somewhere between $6k and $8k a month between an agency retainer and paid promotion. Nobody could say what it bought.
They built the map first. Twenty-two artifacts, and it turned out eleven of them weren't assigned to any touchpoint at all—they existed because a campaign needed them once. Six were outdated enough to be actively misleading about the current org.
Then they instrumented three channels with one shared ROI template and stood up a cohort dashboard. Within a quarter, two things surfaced. The paid LinkedIn promotion was generating applies but a thin qualified ratio—lots of volume, weak fit—while the employee-referral toolkit, which got almost no budget, was producing the strongest 90-day retention. And the post-apply stage was bleeding candidates: close to a quarter of applicants went cold before the first call.
They shifted a few thousand a month from paid promotion into the referral program and added a hiring-manager intro video at the post-apply touchpoint. Time-to-fill on back-office roles dropped by roughly a week and a half. Pre-screen show-rate climbed. Nothing dramatic or overnight—but for the first time the brand budget had a number next to it, and that changed the conversation with finance entirely.
When this operating model makes sense
Build the full model when you're hiring at enough volume and channel diversity that attribution has genuinely gone fuzzy—multiple recruiters, multiple channels, a brand function that produces more than it can track. The model earns its overhead when the cost of guessing wrong on channel spend exceeds the cost of maintaining the map and dashboard.
It also makes sense when you're about to defend or grow an employer-brand budget. Walking into that conversation with a spend-to-outcome dashboard instead of impressions is the difference between keeping the budget and losing it.
When it's a bad idea
If you're hiring in the low double digits a year through one or two channels, don't build this. The informal system still fits in someone's head, and the operating-model overhead will cost more time than it saves. Do the lightweight version: a single spreadsheet mapping your handful of assets to stages, and move on.
It's also the wrong move if your underlying hiring metrics are undefined. If "applied," "qualified," and "hired" mean different things to different people, a dashboard just automates the confusion. Fix the definitions first, instrument second.
Who should not do this yet
Teams without a clear data owner for recruiting metrics will struggle, because the dashboard will drift the moment someone changes how a field is counted. If no one owns the taxonomy, the model decays within a quarter.
And if your employer brand and recruiting functions genuinely don't talk—different leaders, different incentives, real friction—the map will get built and then ignored. The whole thing depends on both sides accepting a shared outcome metric. Fix the ownership question before you fix the attribution question.
The real shift
The move here is conceptual before it's operational. You stop thinking of employer brand as a creative output and start thinking of it as a set of instrumented inputs into a funnel you already measure. Every artifact gets a stage, an owner, a cost, and a job. Every channel reports in the same language. Every quarter you test one thing on purpose. And the whole system rolls up to the two numbers leadership already trusts—how fast you fill, and whether the people you hired were worth hiring.
That's the entire value of an employer-brand operating model: it turns a pile of assets and a pile of funnel data into one connected picture, so the next time someone asks what the brand spend actually did, you have an answer that survives contact with a finance review.
That's the entire value of an employer-brand operating model: it turns a pile of assets and a pile of funnel data into one connected picture, so the next time someone asks what the brand spend actually did, you have an answer that survives contact with a finance review.
Ready to transform your HR processes?
Join thousands of HR teams using Hiryly to hire faster, engage employees better, and stay compliant effortlessly.