


Most HR teams can tell you their cost-per-hire down to the dollar. Ask them what that hire is worth over the next 18 months, and the room goes quiet. That gap — between what we spend on people and what those people actually produce — is where a lot of workforce budgets quietly bleed out.
The problem isn't that HR can't count. It's that the counting stops at the wrong place. We track requisition-to-fill, offer acceptance, first-year attrition. But almost nobody stitches those numbers to the revenue or margin the role was supposed to move. So when finance asks whether it's cheaper to hire two more support reps or train the five you have, the honest answer is usually a shrug dressed up as a spreadsheet.
This is a playbook for building a workforce cost to outcome model that connects hiring decisions to money — with time-to-productivity curves, L&D ROI templates, break-even math, and clear decision gates for hire versus upskill. Less about fancy analytics, more about wiring together numbers you already have but never put in the same room.
Why the cost-per-hire number lies to you
Cost-per-hire is a comfortable metric because it's easy to calculate and it makes recruiting look accountable. But it answers a question almost nobody actually cares about once the role is filled.
What it hides: two hires with identical cost-per-hire can have completely different economics. One ramps in six weeks and stays three years. The other takes five months to hit quota and leaves at month 14. Same acquisition cost. Completely different outcome. If your model stops at the point of hire, both of these look identical, and you'll keep making the same mistake because your numbers can't see it.
In real operations, the expensive part of a hire is almost never the recruiting spend. It's the ramp. A mid-level role that takes four months to reach full productivity is burning salary the entire time while producing a fraction of the output. When you actually chart it, the ramp gap usually dwarfs the recruiting fees by a factor of three or four. Yet ramp time shows up in almost no HR dashboards.
Teams optimize the cheap, visible cost (recruiting) and ignore the expensive, invisible one (time-to-productivity). A cost-to-outcome model flips that priority.
The two curves you need to model everything else
Before you can compare hiring to upskilling, you need two numbers modeled properly. Not estimated in a hallway — actually modeled.
Eliminate HR bottlenecks with smart automation.
Hiryly simplifies your HR operations so you can focus on people, not paperwork.
- Centralized candidate tracking
- Automated onboarding workflows
- Performance & compliance dashboards
No credit card required
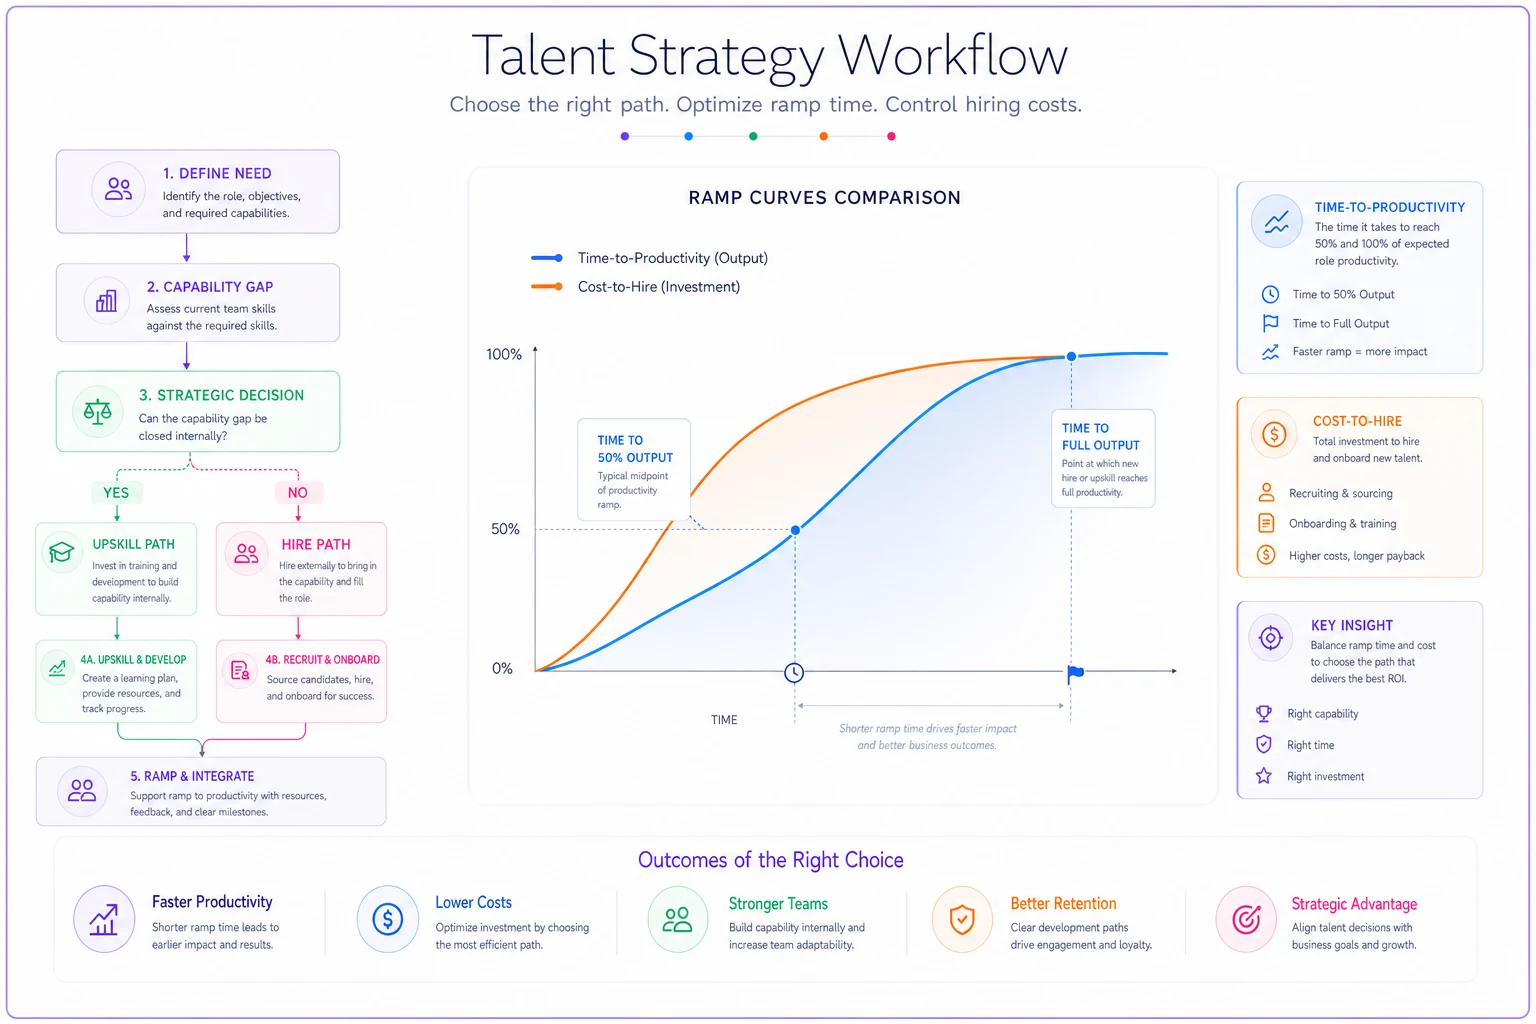
Cost-to-hire (fully loaded). Not just agency fees and job board spend. Include recruiter and hiring manager hours, interview panel time, onboarding setup, equipment, and the productivity drag on the people training the new person. For a typical mid-market role, when you add the hidden time costs, the fully loaded figure often lands 40–60% higher than the number HR reports.
Time-to-productivity. This is the curve that maps how output ramps from day one to full contribution. Most roles don't ramp linearly — they crawl for the first stretch, then accelerate. You need three anchor points: when they produce anything useful, when they hit roughly half their expected output, and when they're fully productive.
A quick visual of these curves helps make the numbers tangible.
| Role type | Fully-loaded cost-to-hire | Time to ~50% output | Time to full output | Cost of the ramp gap |
|---|---|---|---|---|
| Customer support rep | ~$6k–$9k | 3–4 weeks | 8–10 weeks | ~$4k–$6k in unproductive salary |
| Mid-level sales / account role | ~$14k–$22k | 8–10 weeks | 4–6 months | ~$18k–$30k in ramp gap |
The ramp gap column is the one that actually changes decisions. When people see that a sales hire's ramp costs more than the entire recruiting process, the upskill conversation suddenly gets serious.
The mistake is treating time-to-productivity as one company-wide average. It isn't. It varies by role, by manager, by how good your onboarding actually is. Weak onboarding means a flatter ramp curve, and that changes the whole hire-vs-upskill math. Roles with structured onboarding — like the kind mapped out in a good 90-day remote onboarding blueprint — compress the ramp gap significantly, which quietly improves the return on every external hire.
Building the L&D ROI side of the equation
Upskilling has the opposite problem from hiring. Hiring's costs are underreported; L&D's benefits are underreported. Training budgets get approved on vibes and defended with completion rates, which tell you whether people finished a course — not whether anything they learned stuck or made money.
To make upskilling comparable to hiring, you need the L&D equivalent of a time-to-productivity curve. The core template has four inputs:
-
Cost of the intervention — course fees, internal facilitator time, and the productivity lost while people are in training instead of working.
-
Capability lift — the realistic increase in output or quality after the training, expressed as a percentage of the gap between current and target performance.
-
Time to lift — how long before the trained person actually performs at the new level. Training doesn't work the day the course ends.
-
Retention of lift — skills decay. If people don't use it, the lift fades. This is the input everyone forgets.
A realistic example: upskilling four existing support reps to handle a more complex product tier might cost roughly $8k–$12k all-in when you count training time and lost hours. If it lifts their capable ticket volume by even 15–20% and holds for a year, the return usually clears the cost of hiring one additional rep to do the same work — with no ramp gap, because these people already know your systems.
That last point is the quiet advantage upskilling has that raw ROI math misses: your existing people have zero time-to-productivity penalty on everything they already know. They're not learning your tools, your customers, and the new skill. Just the new skill.
The decision gates: when to hire, when to upskill
Neither hiring nor upskilling is universally better — the right answer depends on the situation, and you can make it a decision rule instead of a gut call.
Lean toward hiring when:
-
The capability gap is large — you need a skill nobody internally is close to having.
-
You need capacity and capability at the same time (upskilling adds capability but not headcount).
-
The role has a short ramp curve, so the time-to-productivity penalty is small.
-
Demand is durable, not a temporary spike.
Lean toward upskilling when:
-
The gap is moderate — your people are 60–70% of the way there already.
-
Ramp time for an external hire in this role is long and expensive.
-
Retention risk is high, so you'd rather deepen investment in people who already stay.
-
You have the capacity already but not the capability.
A simple decision gate looks like this:
-
Gate 1 — Capacity check. Do you have the hours to do the work at all, or are people maxed out? If you're genuinely out of hours, upskilling doesn't solve it — you need headcount. Stop here and hire.
-
Gate 2 — Gap size check. If you have capacity, how big is the skill gap? Large gap → hire. Moderate gap → continue.
-
Gate 3 — Break-even check. Run the numbers below. If upskilling breaks even inside your planning horizon, upskill. If not, hire.
The most common mistake is skipping Gate 1. Teams try to upskill their way out of a capacity problem, and six months later everyone's trained and still underwater — because you can't teach your way into more hours in the day.
The break-even calculator
Here's the actual math that Gate 3 runs on. It's not complicated, which is exactly why more teams should do it.
Hiring path total cost (first year): Fully-loaded cost-to-hire + ramp gap cost + annual salary and burden.
Upskilling path total cost (first year): Training cost + productivity lost during training + (existing salary — which you're already paying, so it often nets out of the comparison).
The break-even question: how much additional output does the upskilling need to generate to match what the new hire would produce, net of their ramp gap?
-
Hire path ~$18k cost-to-hire + ~$24k ramp gap + ~$70k loaded salary = roughly $112k in year one, delivering full output only in the back half of the year.
-
Upskill path ~$10k training + ~$6k lost productivity during training = roughly $16k incremental, delivering partial-but-immediate lift from people already at full speed on your systems.
Even if the upskilled coordinators only cover 70% of what the new hire eventually would, the upskill path wins on year-one economics by a wide margin — and it dodges the ramp gap entirely. Where it flips is the second year: if demand keeps climbing, the upskill path runs out of headroom and you're back to hiring anyway. Which is why this decision has to be tied to your demand forecast, not made in isolation.
That connection matters more than the calculator itself. A cost-to-outcome model that isn't wired to demand planning will tell you to upskill right up until the moment you're critically short-staffed. Pairing this with a real quarterly workforce forecast process is what turns a one-time calculation into a repeatable operating decision.
What breaks at scale
A single hire-vs-upskill decision is easy to reason about. The trouble starts when you're making dozens of these decisions across teams every quarter, and each manager is using their own mental model.
Inconsistent inputs. One manager's "cost-to-hire" includes ramp; another's doesn't. Now your numbers aren't comparable, and the model quietly becomes fiction. At scale, the discipline isn't the math — it's forcing everyone to use the same definitions for cost-to-hire, ramp, and capability lift.
No feedback loop. Teams make the hire-vs-upskill call, then never check whether the prediction was right. The upskilled team was supposed to lift output 18% — did it? Nobody measures. Without that loop, your time-to-productivity and L&D-lift assumptions never improve, and you're forecasting with numbers that were guesses two years ago.
Compensation drift. When you upskill people into bigger roles, comp has to follow or you'll train someone into a market-competitive skill set and then lose them to a competitor who'll pay for it. This is where the workforce model has to talk to your rewards structure. Getting the role-banding and promotion cadence right is what makes upskilling a retention play instead of an expensive way to hand competitors pre-trained talent.
Decision volume. At small scale, a director eyeballs each call. At mid-market scale, you're making these decisions faster than any one person can model them by hand, and they default back to "just hire" because it's the path of least resistance. That default is exactly how workforce budgets balloon.
When this model is a bad idea
A cost-to-outcome model isn't free to build or maintain, and there are situations where the effort outweighs the payoff.
If you're a very small team making only a handful of hires a year, formal break-even models are overkill. The decisions are few enough to reason through directly. Building elaborate curves for three hires a year is process for process's sake.
If your time-to-productivity data is pure guesswork with no basis in reality, the model will produce confident-looking numbers built on sand — arguably worse than admitting you're guessing. Fix your ramp measurement first. Even rough tracking from a few structured quality-of-hire experiments beats invented curves.
And if your organization won't actually change decisions based on the model — if leadership will hire whoever they were going to hire regardless of the math — then don't build it. A measurement system nobody acts on is just expensive decoration.
A real scenario
A regional B2B services firm — around 140 employees — kept defaulting to external hires every time a team hit capacity. Their cost-per-hire looked fine, so nobody questioned the pattern. But margins on their delivery teams were slipping, and they couldn't figure out why.
When they finally charted time-to-productivity for their core project roles, the ramp was brutal: close to five months to full output, with a ramp gap costing roughly $25k–$30k per hire on top of recruiting. They were doing four to six of these hires a year and eating that gap every single time without ever seeing it in a report.
They ran the break-even math on two teams and found that upskilling existing junior staff — who already knew the clients and systems — covered about 75% of the capability need at maybe a fifth of the year-one cost, with no ramp gap. They shifted roughly half their planned external hires to internal upskilling paths over the next two quarters.
The result wasn't dramatic on the surface — headcount grew a little slower — but delivery margins recovered a few points, and time-to-coverage on capacity gaps actually shortened, because upskilling an existing person is faster than a five-month external ramp. The bigger shift was cultural: managers stopped treating "hire someone" as the automatic answer.
Making it operational
The playbook only works if it lives somewhere your team actually uses it, not in a one-off spreadsheet that goes stale by Q2. The pieces that need a home:
-
Standardized cost-to-hire and time-to-productivity definitions everyone uses
-
Live ramp curves by role, updated as real hires progress
-
L&D ROI templates with the four inputs above, filled in from actual outcomes
-
The three decision gates as a required step before any capacity requisition
-
A quarterly review comparing predicted lift to actual lift, so the model self-corrects
Locking the three decision gates into your requisition workflow prevents teams from trying to use training to solve pure capacity shortages.
This is where centralizing your workforce data pays off. When cost, ramp, capability, demand forecasts, and comp bands all sit in one connected system instead of five disconnected spreadsheets, the hire-vs-upskill decision goes from a quarterly research project to something a manager can actually run in an afternoon. The point isn't automation for its own sake — it's that the numbers stay honest and comparable when they live together, and honest numbers are the whole game here.
The reason so many workforce budgets feel out of control isn't that HR spends carelessly. It's that the dominant metric — cost-per-hire — measures the cheap part of the decision and stops before the expensive part begins. Once you extend the model to time-to-productivity, ramp cost, and the L&D alternative, the hire-vs-upskill question stops being a gut call and becomes math you can actually defend to finance.
You don't need a data science team to do this. You need consistent definitions, honest ramp curves, a simple break-even calculator, and the discipline to check your predictions against reality. Do that, and headcount spend finally connects to the thing it was always supposed to move — the revenue and margin on the other side of the org chart.
Ready to transform your HR processes?
Join thousands of HR teams using Hiryly to hire faster, engage employees better, and stay compliant effortlessly.